
Bulky products are expensive to keep at Amazon. Every unit takes up cubic feet, and Amazon bills FBA storage by the cubic foot. So when a brand sends one big block of a bulky SKU into FBA, it pays to park units that won’t sell for weeks. A drip feed inbound plan goes straight at that cost. Instead of one large shipment, you send stock into FBA in smaller waves, close to the pace it sells.
In this post, we walk through one brand’s numbers from August 2026. On a bulky absorbent rolls SKU, storage cost came in at 2.6% of that SKU’s sales. Then we cover how the drip worked, where it can backfire, and the checklist we run before each wave.
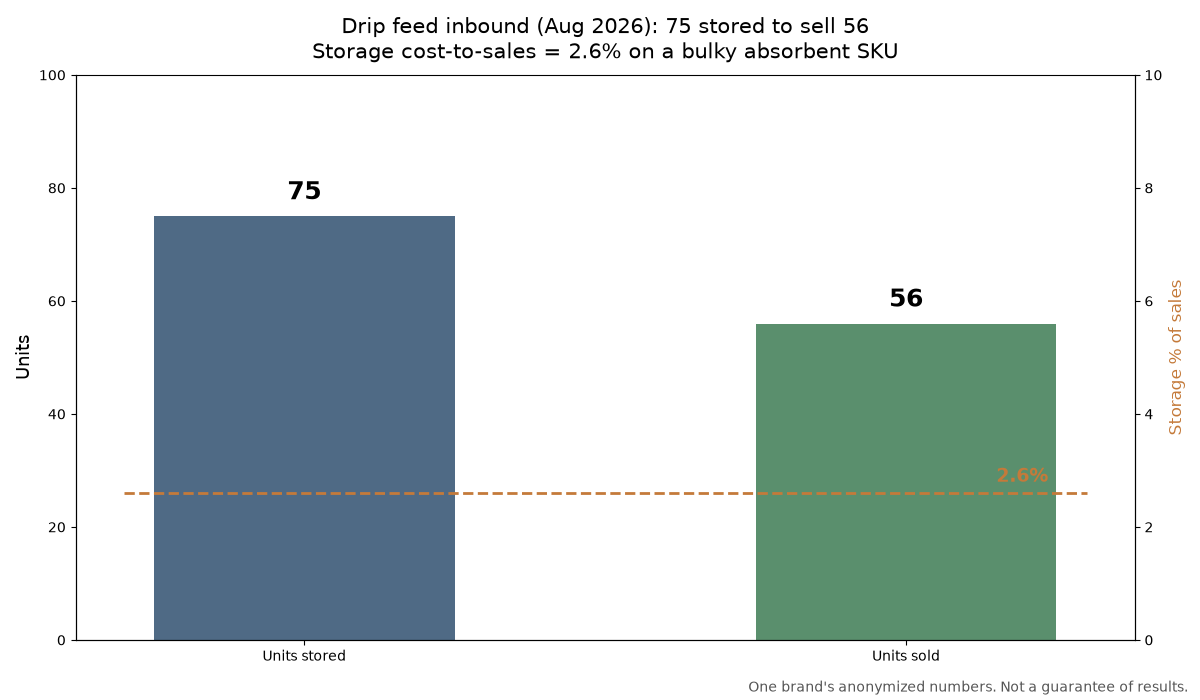
What 2.6% storage-to-sales looked like (75 to sell 56)
The metric is simple. Take the FBA storage fees for one SKU for the month. Then divide by that SKU’s sales for the same month. The result is storage cost as a percent of sales.
In August 2026, one brand’s numbers on a bulky absorbent rolls SKU looked like this:
- About 75 units in storage
- 56 units sold
- Storage cost equal to 2.6% of the SKU’s sales
In other words, the brand held only a little more stock than it sold that month. That is the whole idea. Storage is a charge for space, so fewer idle units in FBA means a smaller bill.
As a brief aside, that rolls SKU also became profitable in the same period, at about 1% after ads. However, the focus here is storage, because storage is the cost a drip feed inbound plan controls most directly.
Worked example: the same SKU on twice the inventory
The numbers below are an illustration, not real data. Picture the same SKU with the same 56 units of sales in the month. Now picture it sitting on 150 units of average inventory instead of 75.
Hold everything else equal: the same product size, the same storage rate, and the same selling price. Storage cost follows the space you occupy, so doubling the units roughly doubles the storage cost. Sales stay the same, because demand did not change. So the ratio roughly doubles too, from about 2.6% to about 5.2% of sales.
Nothing about the product got worse in that picture. The only change is how much stock sat in FBA ahead of demand. On a bulky item with thin margins, a couple of extra points of storage can decide whether the SKU makes money. That is the case for drip feed inbound on bulky products.
How a two-week drip feed inbound plan works
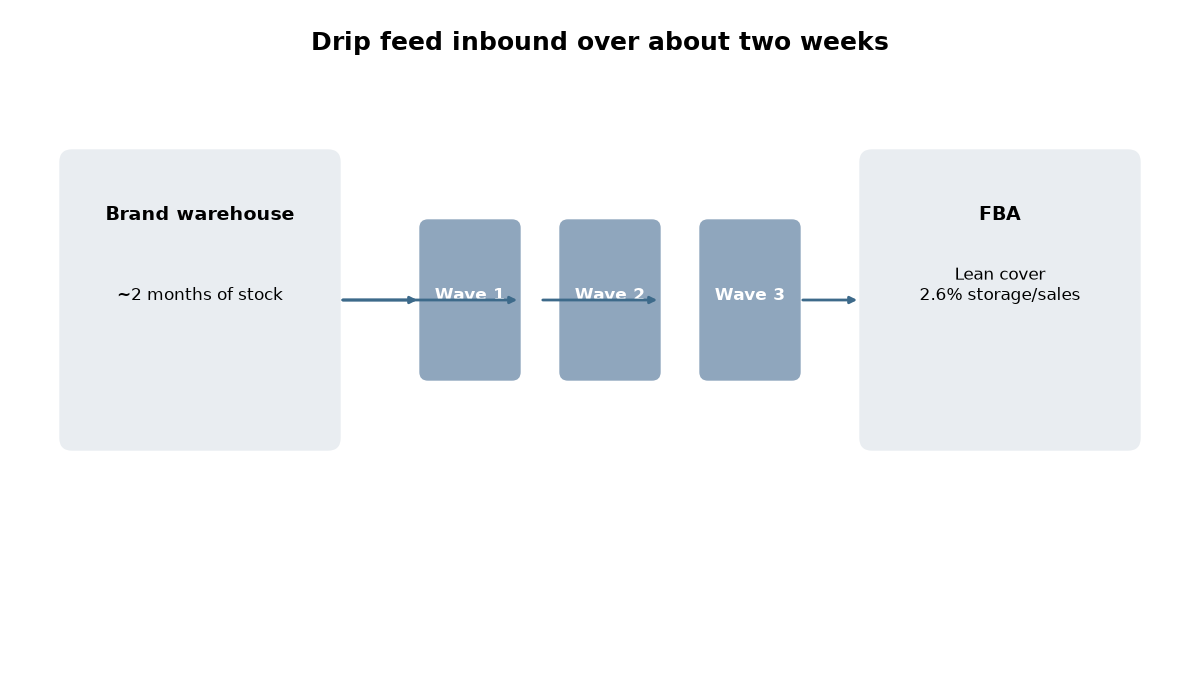
Here is the high-level shape. The brand kept its stock in its own warehouse. It did not park a large block in FBA all at once. Instead, it shipped about two months of stock into FBA over about two weeks, in smaller shipments.
The general pattern looks like this:
- Start from the forecast. Estimate how much the SKU will sell over the next two months.
- Keep the bulk upstream. The stock waits outside FBA until it is needed.
- Split the inbound. Send that stock in smaller shipments over roughly two weeks, not in one drop.
- Watch sell-through. Next, adjust the following wave if sales run faster or slower than the forecast.
Not every brand has its own warehouse. Amazon Warehousing and Distribution (AWD) is another place to hold the upstream stock, but not for bulky items anymore. As of July 31, 2026, US AWD only accepts sortable items. That means units smaller than 18 x 14 x 8 inches and under 20 lb. A bulky SKU like this one does not qualify on new shipments. So for this product, the upstream option is a 3PL. Amazon’s notice also points to GWD, its Global Warehousing and Distribution program in Shenzhen, China, as an alternative for bulky items. Either way, a brand without its own space can still keep the bulk out of FBA and feed it forward.
Timing matters as well. Amazon’s fee card sets FBA monthly storage for October through December 2026 at $2.40 per cubic foot for standard-size items. Oversize items run $1.40 per cubic foot. Those Q4 rates are sharply higher than the rest of the year. So the payoff from keeping bulky stock out of FBA is larger right now.
Drip-feeding and placement fees are separate levers
That same August carried a second lesson. One inbound placement fee of $4,900 drove a record $5,718 in inbound costs for the brand that month.
The lesson applies to any seller. A drip feed inbound plan controls how much inventory sits in FBA. It does not, by itself, control what each shipment costs to send in. Storage and placement are two different bills. So one month can look light on one bill and heavy on the other.
That is why drip planning and placement planning belong side by side. Each wave is a separate shipment, and each one can carry a placement fee. So review the placement cost on each shipment plan as part of the drip, the same way you review wave size.
Balancing drip feed inbound against low-inventory fees and stockouts
Drip-feeding has a failure mode. If you cut FBA stock too thin, you trade one problem for two others.
The first is the low-inventory-level fee. Per Amazon’s Seller Central explanation, this fee can apply when both your 30-day and 90-day historical days of supply fall below 28 days. So a drip that keeps FBA very lean for too long can add a fee that eats into the storage savings.
The second is a stockout. If a wave arrives late, or sales jump, the listing can run out. Then the storage savings matter very little, because there are no sales to protect.
So the goal is not the lowest possible FBA inventory. Instead, the goal is the lowest inventory that keeps days of supply above the low-inventory line and keeps the listing in stock. In practice, that means:
- Send enough in each wave to cover sales until the next wave is checked in, plus a buffer.
- Watch both the 30-day and the 90-day figures, not just one.
- Pull the next wave forward when sell-through speeds up.
Checklist we use before each drip
Before each drip feed inbound wave, we work through the same short list:
- FBA stock and sell-through. How many units are available or inbound, and how fast are they selling?
- Days of supply. Where do the 30-day and 90-day historical figures sit against the 28-day line?
- Upstream stock. How much is left in the brand’s warehouse or in AWD to support the next waves?
- Wave size. Does this shipment cover sales until the next one checks in, without parking extra weeks of stock?
- Placement cost. What does the shipment plan show for placement, and is there a lower-cost routing before we confirm?
- Season. Is it October through December, when FBA storage rates are higher?
- Storage-to-sales. What did storage cost as a percent of sales for this SKU last month?
Then, in a monthly logistics review, we track storage as a percent of revenue, along with logistics costs overall. One month is a snapshot. The trend shows whether the plan is working.
Get our free Q4 FBA Inventory Checklist: what to check from now through December to keep stock selling and storage costs under control.
Form not showing? Get the Q4 checklist here.
See where your storage costs stand
Related guides: Amazon inbound placement fee lesson, Amazon AWD vs FBA, How to save money on Amazon shipping and warehousing, AWD vs 3PL cost calculator, and how the free storage costs audit works.
If storage keeps climbing as a share of your sales, especially on bulky SKUs heading through Q4, a drip feed inbound plan is worth a look. Book the free Storage Costs Audit and we will review your storage costs with you.