
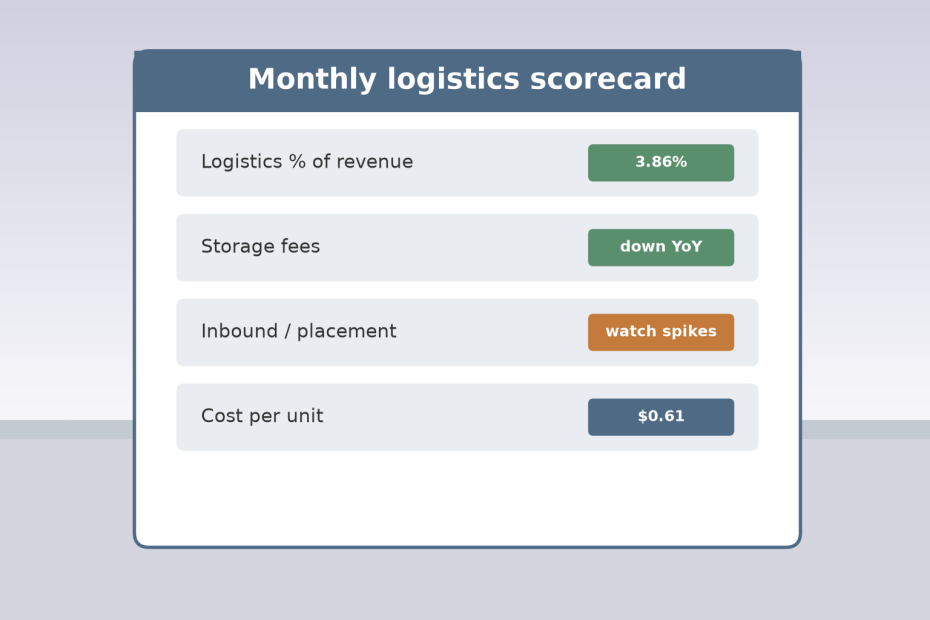
A big storage bill feels bad. However, a fee total on its own tells you very little. A growing brand pays more in fees almost every month, so a bigger bill can still mean a better month. That is why we track logistics cost percentage: the month’s storage, inbound, and related Amazon logistics fees divided by the same month’s revenue.
The percentage answers the question that matters. Is logistics getting more efficient, or just getting bigger? One of our co-founders sells on Amazon himself, and this number is the headline of the monthly logistics review we run. Below is what goes on the scorecard, a few real anonymized months, and a worked example you can copy.
What we put on the monthly logistics scorecard
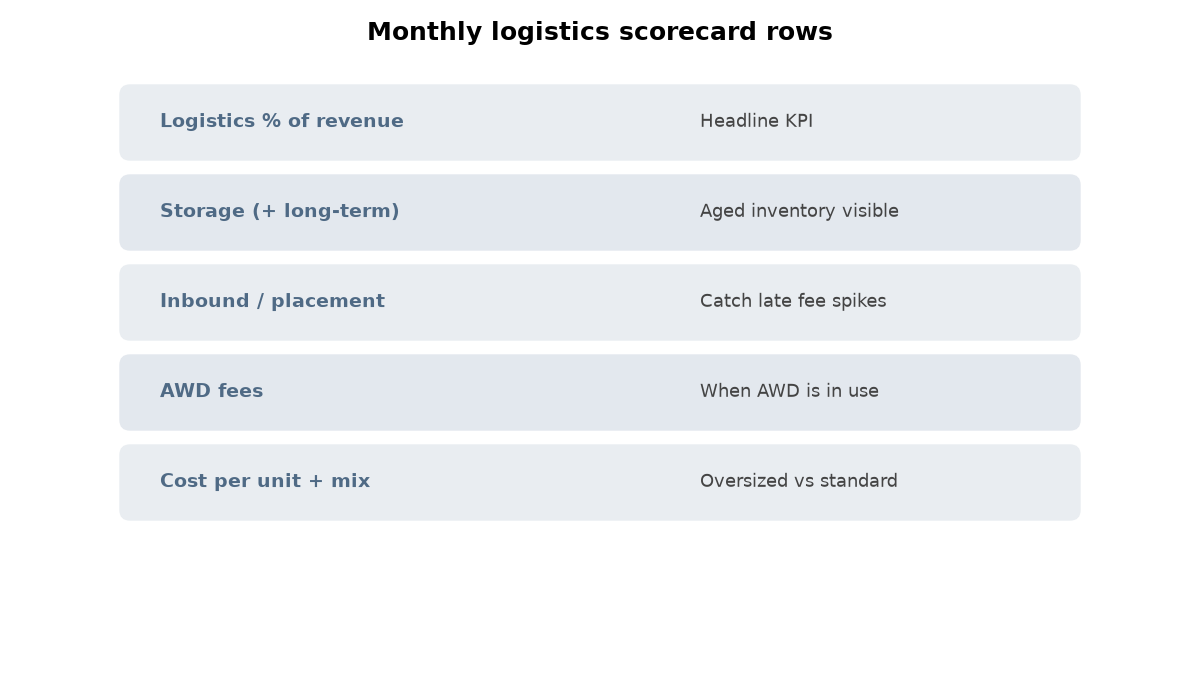
The scorecard fits on one page. Every month gets the same rows, measured the same way:
- Logistics cost as a percent of revenue. The headline number.
- Storage fees. Monthly FBA storage, with the aged inventory surcharge (formerly the long-term storage fee) on its own row so aged inventory cannot hide.
- Inbound and placement fees. What it cost to get inventory into Amazon’s network.
- AWD fees, when used. If the brand stores inventory in Amazon Warehousing and Distribution, those charges go on the same page.
- Cost per unit, with mix notes. Logistics cost divided by units, plus a note on how much of the mix was standard size versus oversized.
- Year-over-year comparison. Each row sits next to the same month a year earlier.
That last row does a lot of work. Sales and fees both shift through the year. So comparing May to April can mislead you. Comparing May to last May shows whether you actually improved.
Real anonymized months from one brand’s scorecard
The numbers below come from one brand that sells a mix of standard-size and oversized products. Here is how its logistics cost percentage and related lines looked across several months.
October 2025: storage dollars down year over year
FBA storage came to $5,300 in October 2025, versus $5,578 in October 2024. Dollar comparisons like this are useful. However, they mean the most when the percentage sits right beside them.
January 2026: the percentage and aged inventory both fell
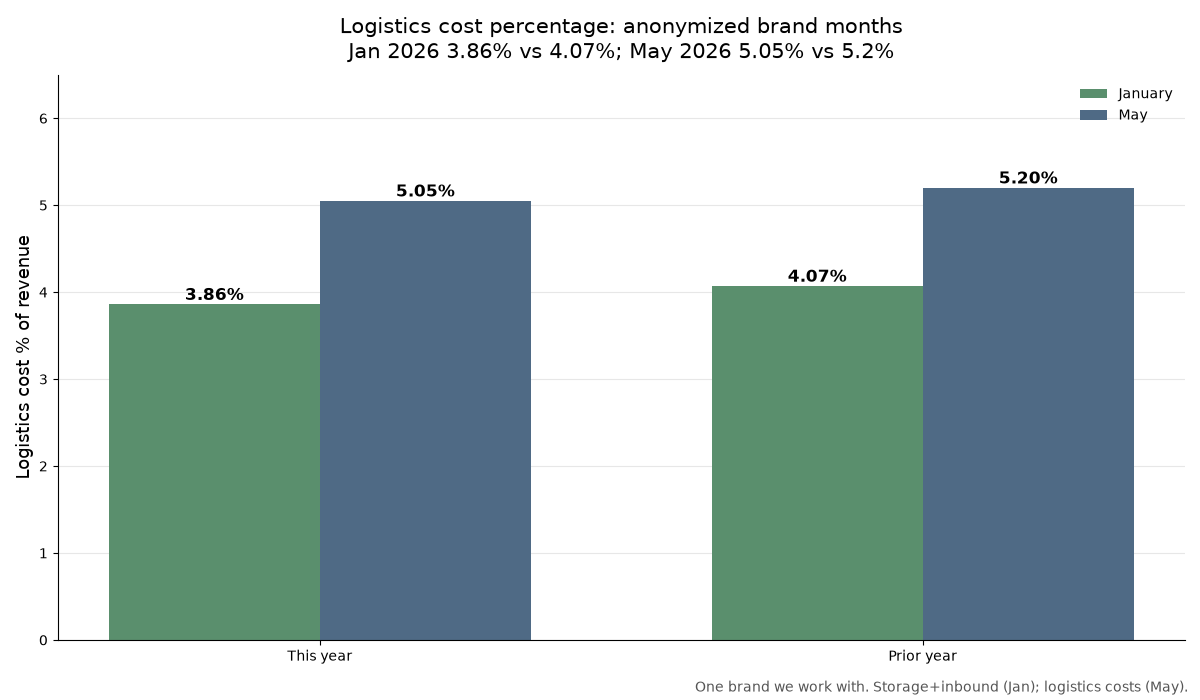
Storage plus inbound costs ran 3.86% of revenue in January 2026. A year earlier, in January 2025, they ran 4.07%. Over the same comparison, long-term storage fees fell from $1,020 to $20.
Both lines matter. The percentage shows overall efficiency. Long-term storage fees build up on inventory that sits too long, so a figure near zero is a sign that stock levels kept pace with sales.
May 2026: a late fee, and the trend held
Logistics costs ran 5.05% of revenue in May 2026, versus 5.2% in May 2025. That held even though a delayed $2,770 placement fee landed in May.
Fees can post late. So a charge can show up in a different month from the shipment behind it. Without a scorecard, May would look like a step backward. With one, the fee sits on its own line, and the year-over-year trend still points the right way.
Notice, too, that May ran higher than January. That is exactly why each month is compared to the same month a year earlier, not to the month before.
August 2026: a spike is not a trend
In August 2026, a single $4,900 placement fee pushed inbound costs to a record $5,718 for the month.
On a raw-dollar chart, August looks alarming. However, one fee is not a pattern. So the scorecard separates the spike from the trend. The fee gets its own line, flagged as a one-off. Then the review asks a simple question: was this a single charge, or the start of something that calls for a change in how shipments are routed?
Cost per unit and oversized mix
The percentage is the headline. Cost per unit is the check underneath it.
For the brand above, cost per unit rose to $0.61 from a $0.35 baseline. The reason was mix: more oversized units. A new target was being set, likely in the $0.50 to $0.60 range.
Cost per unit can climb even while logistics cost percentage improves, because the two numbers measure different things. Cost per unit compares logistics cost to units. The percentage compares it to revenue. Oversized items take more space and cost more to store and ship, so a shift toward them pushes cost per unit up. The percentage only rises if revenue fails to keep pace.
That is why the scorecard carries a mix note. Without it, a rising cost per unit looks like a problem. With it, you can tell whether the change came from what you sell or from how you ship it. A target range also keeps the monthly review focused. Is the number inside the range? If not, is the cause mix, or something you can change?
Worked example: reading one month’s logistics cost percentage
The numbers in this section are hypothetical. They do not come from the brand above.
Step 1: Total the month. Say a brand has $800,000 in revenue and $20,000 in total logistics costs for the month. That total covers storage, inbound and placement fees, and AWD fees if any.
Step 2: Divide. $20,000 divided by $800,000 is 2.5%. That is the month’s logistics cost percentage.
Step 3: Add a one-off. Next, say a single $4,900 placement fee lands in the same month, and nothing else changes. Total logistics costs become $24,900. Divided by $800,000, that is about 3.1%.
| Hypothetical month | Without the fee | With the fee |
|---|---|---|
| Revenue | $800,000 | $800,000 |
| Logistics costs before the fee | $20,000 | $20,000 |
| Placement fee (one-off) | $0 | $4,900 |
| Total logistics costs | $20,000 | $24,900 |
| Logistics cost percentage | 2.5% | about 3.1% |
Step 4: Read it. One fee moved the percentage by about 0.6 points. That is a big jump from a single line. So you report the full 3.1%, because that is what the month really cost. However, you also flag the $4,900 as a one-off line, so the underlying 2.5% stays visible.
Why bother with the flag? Because a one-off and a trend need different responses. If next month drops back near 2.5%, the spike was a single event. If it stays near 3.1%, something in your routing or your mix has changed, and that deserves a closer look.
How to start this scorecard in Seller Central reports (and our inbound placement fee walkthrough)
You can build a first logistics cost percentage scorecard in a spreadsheet, using reports you already have.
- Revenue. Pull the month’s sales from Date Range Reports (under Payments) or from Business Reports. Pick one source and use it every month.
- Storage. Under Reports, then Fulfillment, download the monthly storage fee and aged inventory surcharge reports.
- Inbound and placement. Generate a Transaction report from Date Range Reports and filter for inbound and placement fees.
- AWD. If you use AWD, add its charges for the month.
- Units and mix. Take units from Business Reports, and tag each SKU as standard size or oversized.
- Last year. Repeat steps 1 through 5 for the same month a year earlier.
Then set one rule for late fees. For example, record each fee in the month it posts, and add a note when it belongs to an earlier shipment. That keeps months like the May example above readable.
Finally, review it at the same point each month. The goal is not a perfect spreadsheet. It is the same handful of numbers, measured the same way, month after month.
Get our free Q1 FBA Inventory Checklist: what to clean up January through March so last season’s leftovers do not eat into this year’s margin.
Form not showing? Get the Q1 checklist here.
Find out where your logistics cost percentage stands
If storage, placement, or low-inventory fees keep surprising you, start with a baseline. Book the free Storage Costs Audit at https://amazonstoragepros.com/free-costs-audit/ and see where your numbers stand today.
Related guides: Amazon inbound placement fee lesson, What is a fractional Amazon logistics manager, How to save money on Amazon shipping and warehousing, AWD vs 3PL per-unit cost, and how the free storage costs audit works.
If you want a second look at your numbers, book a free Storage Costs Audit.